Chase Card Spotlight7 October 2026 · 3 min read
Charizard VMAX Chase Card Spotlight: Is It Worth Grading? (2026-10-07)
Raw vs PSA 10 pricing, grading ROI and TCGInvest's grade signal for Charizard VMAX from Darkness Ablaze.
Track these live, free →
⚠ For informational purposes only. Data sourced from eBay UK sold listings and TCG Invest's price pipeline. Not financial advice.
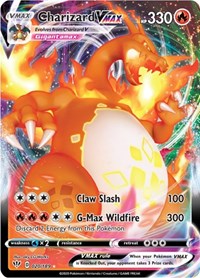

Charizard VMAX (#20) — Darkness Ablaze
Special Rare · SWSH era
Raw: £25.07 (-21% 30d)
PSA 10: £107.15 (-4.5% 30d)
Grade multiplier: nullx
Grading ROI: £null (null%)
Special Rare · SWSH era
Raw: £25.07 (-21% 30d)
PSA 10: £107.15 (-4.5% 30d)
Grade multiplier: nullx
Grading ROI: £null (null%)
Charizard VMAX from Darkness Ablaze (SWSH era) is a Special Rare chase card that deserves close attention from UK investors monitoring grading economics. The raw market has experienced a sharp 21% decline over 30 days, significantly outpacing the modest 4.5% drop in PSA 10 values, making this an important case study in how certification can buffer portfolio volatility during market downturns.
Pricing & Grading Economics
TCGInvest Grade Signal: Unrated
Grading Decision Box
Assumed grading cost: £20 (typical bulk PSA service + shipping)
Break-even PSA 10 price needed: £45.07
Current PSA 10 price margin above break-even: £62.08
Assumed grading cost: £20 (typical bulk PSA service + shipping)
Break-even PSA 10 price needed: £45.07
Current PSA 10 price margin above break-even: £62.08
Price Points
Raw (ungraded)
Market Price
£25.07
Medium Volatility
(9.5% 30-day price swing)
30-Day Low: £25.07
30-Day High: £31.75
Track these prices live
Free tools updated monthly — no account required for basic data